Sol sold some of its Dell shares
12 August 2026
Dell's share of the portfolio5.2%
New target3.5%
After Dell rallied, Sol used the risk tool to check a smaller holding. Shares were sold the next morning.
Five frontier models ran a long/short book for two months inside a terminal rebuilt from the public record. Only one showed a usable forecast signal, and its book still finished level with the index.
Each model forecast five-day returns relative to SPY across 498 stocks, then traded on its own calls. Only Fable's signal cleared the usual 0.05 floor, and its book still finished level with the index.
Rank correlation of forecast and realized five-day returns · 38 resolved dates · Dashed: 0.05, the usual floor for a usable signal
Percentage points over the index · Three of five below zero
Beta-adjusted return per unit of risk · Below zero is worse than SPY
Peak-to-trough loss · Shorter is better
| Model | Forecast IC | Return | vs SPY | Info. ratio | Max. drawdown |
|---|---|---|---|---|---|
| Sol | 0.026 | +4.56% | +3.47 pp | 1.61 | −3.13% |
| Opus | 0.029 | +2.11% | +1.03 pp | 0.96 | −2.19% |
| Fable | 0.073 | +1.08% | −0.004 pp | 0.40 | −5.03% |
| Astra | 0.014 | +0.39% | −0.70 pp | −0.37 | −2.83% |
| Grok | 0.010 | +0.52% | −0.57 pp | −1.30 | −4.69% |
Ordered by information ratio. SPY returned +1.08%. Metrics are computed per run, then averaged by model.
Rank correlation between predicted and realized five-day stock returns relative to SPY. Zero means no ranking signal. A common rule of thumb treats 0.05 as the floor for a usable signal.
Annualized beta-adjusted daily return divided by its volatility, with the benchmark's downside guard.
Forecast IC covers 38 resolved dates; five remain pending.
Returns include the Vylor shares owed on Corteva shorts, valued at the October 1 close.
Four documented errors. Each was identifiable from the data the model had in front of it at the time.
These errors were identifiable at the time. They do not establish that the opposite decisions would have made money.
12 August 2026
After Dell rallied, Sol used the risk tool to check a smaller holding. Shares were sold the next morning.
24 September 2026
Searched MGM news: nothing found
Checked a shareholder filing: the proposed takeover was called off
Decision: sell all MGM shares
The sale went through the next morning.
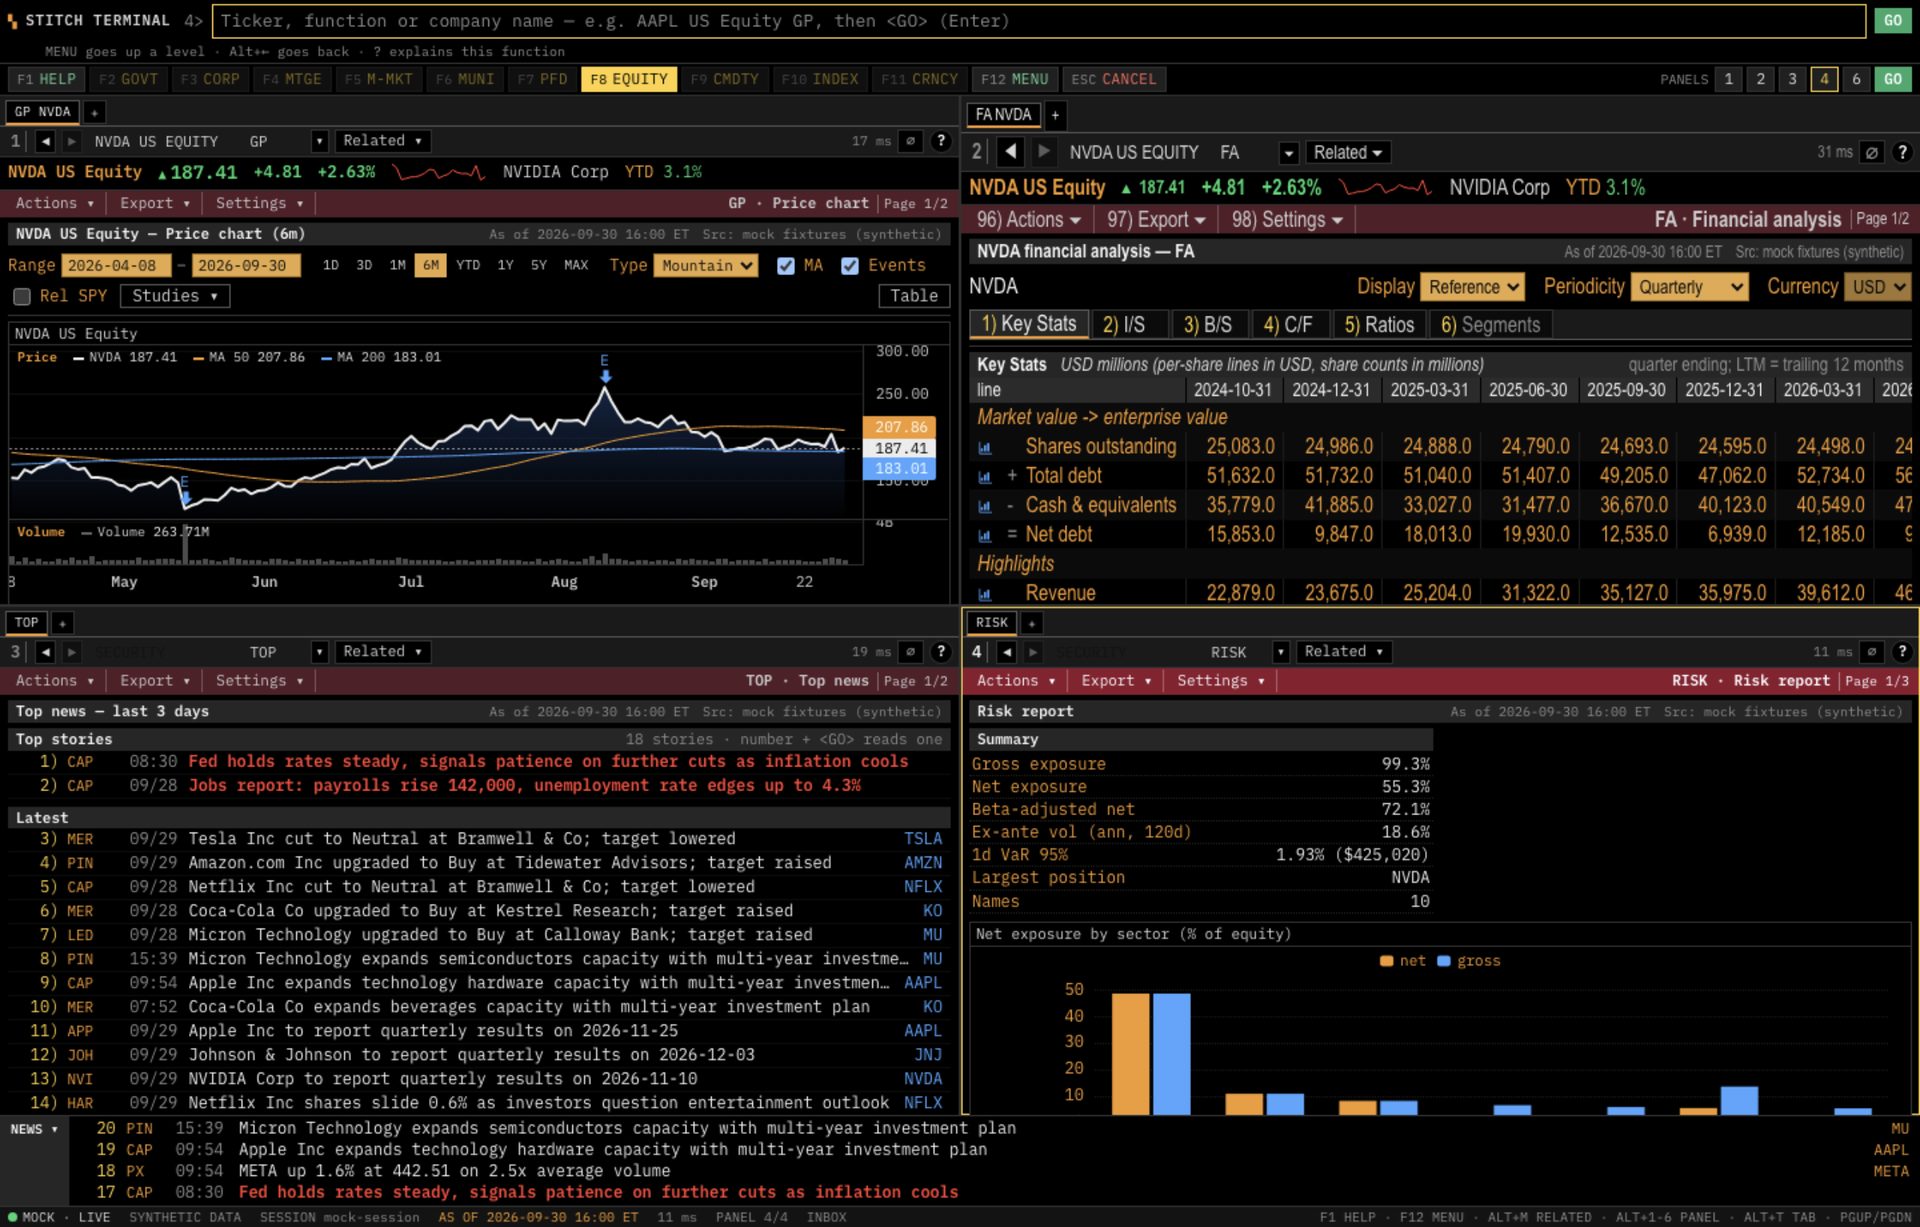
Data rebuilt through time from the public record.
Counts as of 8 October 2026. Prices, index membership and news come from open or unofficial feeds and are not shown here.
The sell-side layer a terminal normally licenses was reconstructed from what companies and the wire say in public. Three real records from the store:
“Boeing to Release Second Quarter Results on July 28”
prnewswire.com · seen on the wire 1 Jul 2026
59 of 59 headline-sourced dates exact
“Tigress Financial Lifts NVIDIA (NVDA) Price Target, Keeps Strong Buy Rating”
insidermonkey.com · seen on the wire 1 Jun 2026
26,261 analyst actions from headlines alone
“Abbott projects full-year 2025 adjusted diluted earnings per share of $5.05 to $5.25”
accepted by EDGAR 16 Apr 2025 07:37 ET
9,027 guidance lines, each quoting its release
Read before quoting. The window is short and the sample is small.
3 Aug–1 Oct 2026 · 498 stocks · 43 decision dates
Terminal-only research. Decisions fill at the next open; final-day orders remain unfilled.
We chose a short, recent window to keep evaluation outcomes after the models' stated pretraining cutoffs. Noise is substantial over just 43 decision dates: returns and rankings are not evidence of persistent investment skill. Starting portfolios differ, and individual information-ratio confidence intervals include zero.
Original ledger replay matched recorded equity. Report valuations include the spin-off correction; historical trades and fees are retained. A missing-usage error caused Grok to hold on 7 July. Missing-document errors also occurred.
Product: daily data, no live execution; incomplete document coverage. Production reliability and data rights remain work in progress.
Scoring versions: book-v4, events-v3, universe-v2. All returns are simulated.
We will run any model you name through the same terminal and window, and send you every decision, forecast and ledger. Contact us for access to the codebase.